DCO Launches Digital Economy Navigator to Bridge Digital Economy Gap Worldwidehttps://english.aawsat.com/business/5063556-dco-launches-digital-economy-navigator-bridge-digital-economy-gap-worldwide
DCO Launches Digital Economy Navigator to Bridge Digital Economy Gap Worldwide
DCO Secretary-General Deemah AlYahya - SPA
The Digital Cooperation Organization (DCO) has launched its inaugural Digital Economy Navigator (DEN) that enables countries to better navigate the paths to digital economy maturity, find opportunities for growth, benchmark progress, and bridge the gap in digital economy maturity, SPA reported.
DEN was unveiled at SDG Digital, held this year during the 79th Session of the UN General Assembly in New York from September 10 to 27.
Drawing upon officially disseminated statistics, secondary data, and unique proprietary data from a large DCO survey, DEN is a unifying framework that addresses digital economy maturity across 50 countries, including the DCO member states. The framework provides a platform for nations, stakeholders, and decision makers to harmonize efforts to advance the global digital economy, enable accessibility, sustainability, and shared prosperity across borders.
The navigator evaluates the extent to which factors contribute to economic prosperity, sustainability, and improved quality of life. This provides a common understanding for different stakeholder groups to work together in developing digital economy strategies to bridge gaps and allows for progress to be tracked over time.
DCO Secretary-General Deemah AlYahya said: “The Digital Economy Navigator aims to enhance accessibility, sustainability, and economic prosperity, ensuring that countries are not just keeping pace but leading in the digital era. As the first global framework to comprehensively address digital economy maturity from a user-centric perspective, DEN plays a pivotal role in advancing the DCO’s mission of supporting evidence-based policies and impactful outcomes in the digital economy. By providing reliable and detailed data, insights into current trends and emerging technologies, and strategic foresight into future challenges, DEN equips countries to achieve higher levels of prosperity, inclusion, and sustainability. We, at DCO, are committed to empowering stakeholders with the knowledge they need to navigate and thrive in the ever-evolving digital landscape.”
DEN is relevant for policymakers, business executives, and experts in digital economy. Decision makers are equipped with the research, data, and analysis necessary to cultivate a more inclusive digital economy and society, encourage digital innovation, create jobs, accelerate GDP growth, amplify sustainability through digital technologies, and enhance overall wellbeing.
Uniquely among global tools, DEN assesses the digital economy through the lens of three intersecting dimensions: Digital Enablers, Digital Business, and Digital Society. Within the three dimensions, 10 pillars synthesize and summarize key aspects of countries’ digital economy and use of digital technology application from 102 indicators gathered from secondary data sources, as well as primary data from a novel survey of more than 27,000 people across the 50 countries.
DEN introduces a comprehensive maturity classification system with five categories based on pillars’ scores from 0 to 100 that can be used by stakeholders to better target and focus initiatives to drive digital advancement and innovation in their quest for sustainable and inclusive growth of their digital economy.
DEN reveals a diverse picture of maturity across regions. North America, for example, leads in digital innovation, followed by Europe and Central Asia, and East Asia and Pacific. South Asia leads in digital work and training, followed by the Middle East and North Africa region. The Sub-Saharan Africa, and Latin America and the Caribbean regions are advanced in the digital education and health services. This pillar particularly, “Digital for education and health”, demonstrate substantial global maturity, with moderate variability in scores indicating a trend toward global convergence.
Saudi Arabia, Türkiye Strengthen Supply Chains with Land Corridor Bypassing Maritime Chokepointshttps://english.aawsat.com/business/5282621-saudi-arabia-t%C3%BCrkiye-strengthen-supply-chains-land-corridor-bypassing-maritime
Saudi Arabia, Türkiye Strengthen Supply Chains with Land Corridor Bypassing Maritime Chokepoints
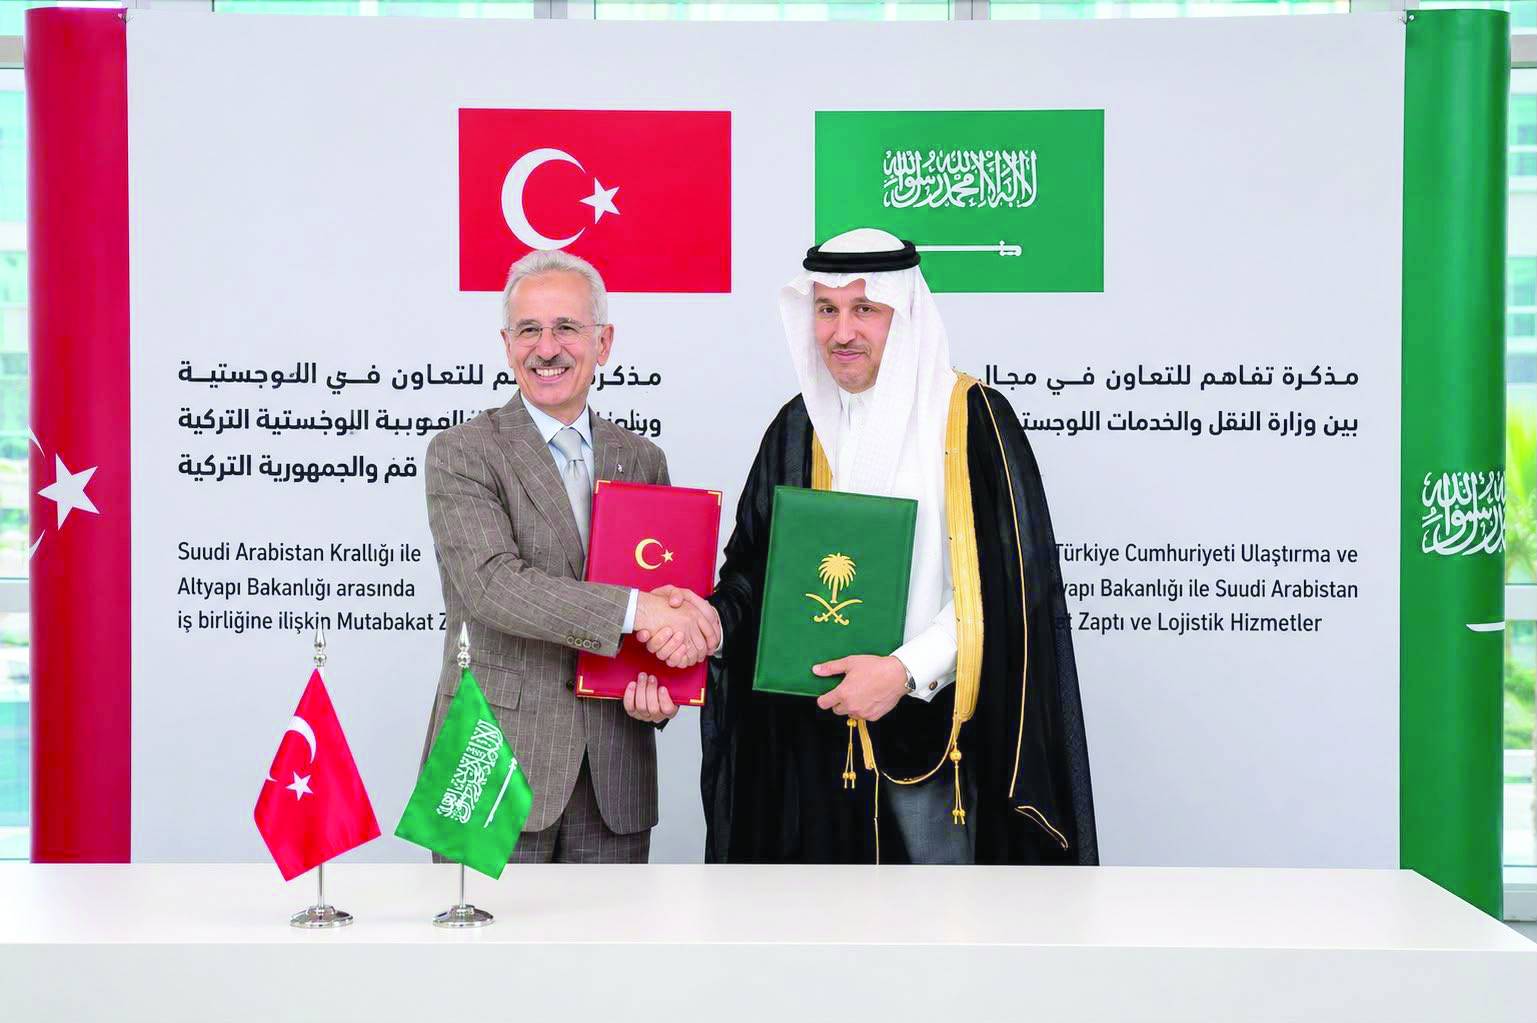
Saudi and Turkish transport ministers meet to strengthen cooperation (X)
At a time when the near-total closure of the Strait of Hormuz and the escalating U.S.-Iran war have put global supply chains under complex geopolitical strain since late February, a strategic land corridor is emerging from the heart of the maritime blockade, promising to redraw the map of international transport and trade.
Between Riyadh and Ankara, a surge in logistics activity is moving beyond conventional bilateral cooperation. It is shaping a secure, sustainable overland alternative for energy, goods and regional food supplies bound for global markets.
The official signing on Tuesday by Saudi Minister of Transport and Logistics Services Saleh Al-Jasser and his Turkish counterpart, Abdulkadir Uraloğlu, of comprehensive memorandums of understanding on railways, logistics operations and technology laid the operational foundation for that shift.
The agreements go beyond easing the immediate movement of goods. They aim to build a cross-border connectivity system that can serve as an operational line of defense against the current maritime crises.
According to the Turkish minister, the rail link rests on infrastructure that already exists in both Saudi Arabia and Türkiye. He said the Saudi side had completed its section up to the Jordanian border, while Türkiye’s rail network extends into Syrian territory. Iraq could later join the project, he added.
How the network connects
Technically and operationally, the corridor is taking shape as a connected rail network built around geography. The line starts in Istanbul, linking Türkiye’s advanced network to the Arab interior. It crosses Türkiye’s southern border into Syria through Aleppo, then runs south to Damascus, the project’s central anchor.
From the Syrian capital, the route crosses into Jordan, passes through Amman and reaches the Saudi border at the Haditha crossing. That strategic point is where the Syrian and Turkish networks meet the advanced infrastructure of Saudi Arabia Railways (SAR).
Inside Saudi Arabia, the route takes on major development weight. Its main and branch lines pass through major projects, such as the Port of Neom, which is seen as a future logistics corridor linking Red Sea ports. It then connects Makkah and Medina before integrating with the unified Gulf railway network.
That Gulf extension opens the way for the line’s long-term goal of reaching Oman and the Arabian Sea, giving it the profile of a comprehensive intercontinental land corridor that bypasses traditional maritime choke points.
Turning the kingdom into a transit hub
Logistics expert Nashmi Al-Harbi told Asharq Al-Awsat that the signed memorandums “translate in practical terms the vision of creating a land corridor that directly links the Gulf to Europe through Jordan, Syria and Türkiye.”
Al-Harbi said Saudi Arabia’s two maritime outlets, on the Red Sea and the Arabian Gulf, combined with Türkiye’s position as Europe’s natural land gateway, “turn Saudi Arabia from a logistics endpoint into a genuine strategic transit hub connecting three continents.”
“The added value for supply chain resilience lies in drawing on the lessons of Red Sea disruptions, which proved that diversifying corridors has become an urgent necessity, not an economic luxury,” he said.
He said the project would create alternative land routes that strengthen transport resilience between Asia and Europe, away from the impact of maritime chokepoint closures or swings in marine insurance costs. Required investment in the line is estimated at about $5.5 billion, he added.
Al-Harbi said the project “fully aligns with the National Transport and Logistics Strategy, which aims to consolidate the kingdom’s position as a global hub.”
It also supports regional connectivity and the localization of the railway industry, he said, building on a strong base after the kingdom ranked fifth globally in container handling speed.
He said the project’s practical impact, including the exchange of best practices in freight, last-mile services and joint logistics centers, would cut cargo transit times between the Gulf and Europe from more than 30 days on traditional sea routes to less than two weeks by land once completed.
Al-Jasser and Uraloğlu shake hands after signing the two memorandums of understanding (X)
Alternatives as shipping costs soar
Logistics expert Hassan Al-Hilal told Asharq Al-Awsat the Saudi-Turkish memorandums represent “a strategic step that strengthens the kingdom’s role as a major center for re-exporting and distributing goods.”
He said the move comes at a critical moment for global trade. “Geopolitical disruptions in vital maritime corridors in recent months have caused record jumps in shipping and marine insurance costs, exceeding 300% compared with pre-crisis levels, as ships have been forced to take longer and riskier alternative routes,” he said.
Al-Hilal said the Saudi-Turkish logistics corridor gives suppliers and exporters “multimodal transport options, combining maritime shipping through Saudi ports with land and rail transport extending through Türkiye toward European and Central Asian markets.”
“This operational diversity directly helps reduce costs linked to storage and rehandling, and limits reliance on a single maritime route,” he said. “It ensures the stable flow of goods and products with high competitive efficiency, maximizing the benefits of the kingdom’s large investments in its port infrastructure.”
Key differences
Comparing the route with the India-Middle East-Europe Economic Corridor, or IMEC, Al-Harbi identified three key differences that he said gave the Saudi-Turkish route the edge.
“The first is the geographic route, which passes through Syria and Jordan to Türkiye, rather than IMEC’s passage through Israel. The second is the nature of implementation, as the current project is based on signed memorandums with a clear technical road map, compared with IMEC, which has been suspended since 2023. The third difference lies in the geopolitical dimensions. Türkiye, which had previously criticized the corridor for bypassing its territory, is returning through this new route strongly to the heart of the strategic Eurasian connectivity map,” he said.
Al-Hilal added what he called a decisive operational difference. IMEC, he said, is “a long-term strategic project that requires massive structural investment,” while current Saudi-Turkish cooperation is based on “maximizing the use of infrastructure that already exists” and on immediate operational links between two advanced logistics networks.
That makes it capable of delivering tangible results in the foreseeable term and at a much faster pace to meet current market needs, he said.
Joseph Salem, partner and head of travel, transport and hospitality at Arthur D. Little Middle East, said: “Reviving the Hejaz Railway is one of the most prominent infrastructure projects in the region’s modern history. The two memorandums of understanding signed in Riyadh between Saudi Arabia and Türkiye, one covering logistics services and the other railway technology, bring the project one step closer to implementation.”
He said an operational line would give the Gulf a direct overland trade corridor to Europe, reducing reliance on sensitive maritime passages at a time when supply chain resilience has become a growing strategic priority.
“The most important challenge remains implementation, whether in terms of financing, the stability of transit routes, or turning feasibility studies expected to be completed by the end of the year into actual investments,” Salem said.
“The importance of these two memorandums stems from the fact that they address the essential pillars of any cross-border railway project, including the standardization of technical specifications, signaling standards and regulatory alignment,” he added.
“If these elements are in place, the Hejaz Railway could regain its position within the next decade as one of the most important strategic land corridors linking Europe and the Gulf.”
Reviving a century-old legacy
The emerging land artery is not new. It is an ambitious revival, with a modern investment mindset, of a legacy dating back more than a century. It is an extension of the Hejaz Railway, which began operations in 1908 and linked Istanbul with Medina and Mecca through Syria and Jordan.
At the time, Damascus was a main anchor point, with lines branching north and south, as well as vital extensions to Lebanon, especially Beirut, and the historically Palestinian port of Haifa. The railway formed an integrated regional network before it broke apart during World War I.
From Neom to the border
The agreements follow advanced operational steps by the parties to the route. Ankara announced the activation of a trilateral memorandum of understanding with Syria and Jordan to modernize networks and connect the rail line between Türkiye and Aleppo, before integrating the Aleppo-Damascus-Jordan line.
Saudi Transport Minister Saleh Al-Jasser said the Saudi rail network already extends to the Jordanian border via the Haditha crossing, giving the project significant implementation flexibility. Joint technical studies will be completed by the end of this year to strengthen a sustainable land transport system, he said.
According to technical information, the new route will pass through the Port of Neom, linking the kingdom’s giga-projects to the heart of Europe through Türkiye.
International financing and operational pressure
In a related move that strengthens the corridor’s readiness, the Asian Infrastructure Investment Bank, or AIIB, approved a 645.83 million euro loan, equivalent to about $750 million, as a first package to help finance a new 127-km green railway line in Türkiye.
The strategic project, known as the Northern Istanbul Railway Crossing Project, aims to bypass Istanbul’s congested urban area and provide a high-capacity land link for freight and passengers across the Istanbul Strait. It would help ease bottlenecks in international supply chains and connect Türkiye’s two largest airports to the rail network.
The Turkish project’s total strategic cost is estimated at about $8.27 billion, with participation from the World Bank and other international financing institutions to raise the share of Eurasian rail transport.
In the final analysis, the joint rail push lays the groundwork for an unprecedented shift in regional shipping by removing the time and geographic obstacles imposed by maritime disruption. Cutting goods delivery times to less than two weeks would redirect investment toward this emerging land artery, at the expense of traditional routes and suspended alternatives.
FII Institute Names Princess Maha bint Mishari Al Saud as CEOhttps://english.aawsat.com/business/5282409-fii-institute-names-princess-maha-bint-mishari-al-saud-ceo
FII Institute Names Princess Maha bint Mishari Al Saud as CEO
Princess Maha bint Mishari bin Abdulaziz Al Saud (Asharq Al-Awsat file photo)
The FII institute, run by a global nonprofit foundation of Saudi sovereign wealth fund PIF, has named Princess Maha bint Mishari bin Abdulaziz Al Saud as its CEO, according to the institute's website.
“With more than 25 years of leadership experience spanning healthcare, academia, strategic partnerships, and international engagement, Dr. Al Saud has built a distinguished career centered on creating impact through collaboration and institution-building. She has worked across the public, private, and nonprofit sectors to advance initiatives that strengthen organizations, expand opportunity, and improve lives,” the website said.
Before joining FII Institute, she served as Vice President of External Relations and Advancement at Alfaisal University.
She has helped expand strategic partnerships, deepen international engagement, and elevate the university’s global standing in education, research, and innovation.
“A recognized advocate for leadership, healthcare transformation, education, and human development, Dr. Al Saud has represented Saudi Arabia at major international forums, including the G20, and the fourth Eurasian Women’s Forum,” FII Institute said.
“Dr. Al Saud holds an MBBS degree and is certified by the American Board of Internal Medicine, having completed her residency training at George Washington University. Her executive credentials include the Senior Executive Leadership Program at Harvard Business School, IMD Business School and she holds the prestigious, peer-reviewed distinction of Master of the American College of Physicians (MACP),” it added.
Egypt Clears Arrears to Oil and Gas Companieshttps://english.aawsat.com/business/5282403-egypt-clears-arrears-oil-and-gas-companies
People walk past a shop selling football jerseys in Khan el-Khalily Bazar in Cairo on June 9, 2026. (AFP)
TT
TT
Egypt Clears Arrears to Oil and Gas Companies
People walk past a shop selling football jerseys in Khan el-Khalily Bazar in Cairo on June 9, 2026. (AFP)
Egypt's Minister of Petroleum Karim Badawi said on Wednesday that the full settlement of arrears owed to oil and gas partners marked a turning point for the sector.
Badawi said payment of the arrears, "restores investor confidence and paves the way for increased upstream activity and accelerated project development".
Egypt had accumulated about $6.1 billion in arrears to foreign oil companies by June 30, 2024 due to a prolonged foreign currency shortage that delayed payments and weighed on investment and gas output. The shortage has since eased, though some companies have said that arrears kept accumulating.
The minister said clearing the debt removed a key obstacle to new investment inflows and would support increased exploration, drilling and field development activity, including projects in the Mediterranean where development typically requires significant capital spending and years of work before production begins.
لم تشترك بعد
انشئ حساباً خاصاً بك لتحصل على أخبار مخصصة لك ولتتمتع بخاصية حفظ المقالات وتتلقى نشراتنا البريدية المتنوعة