

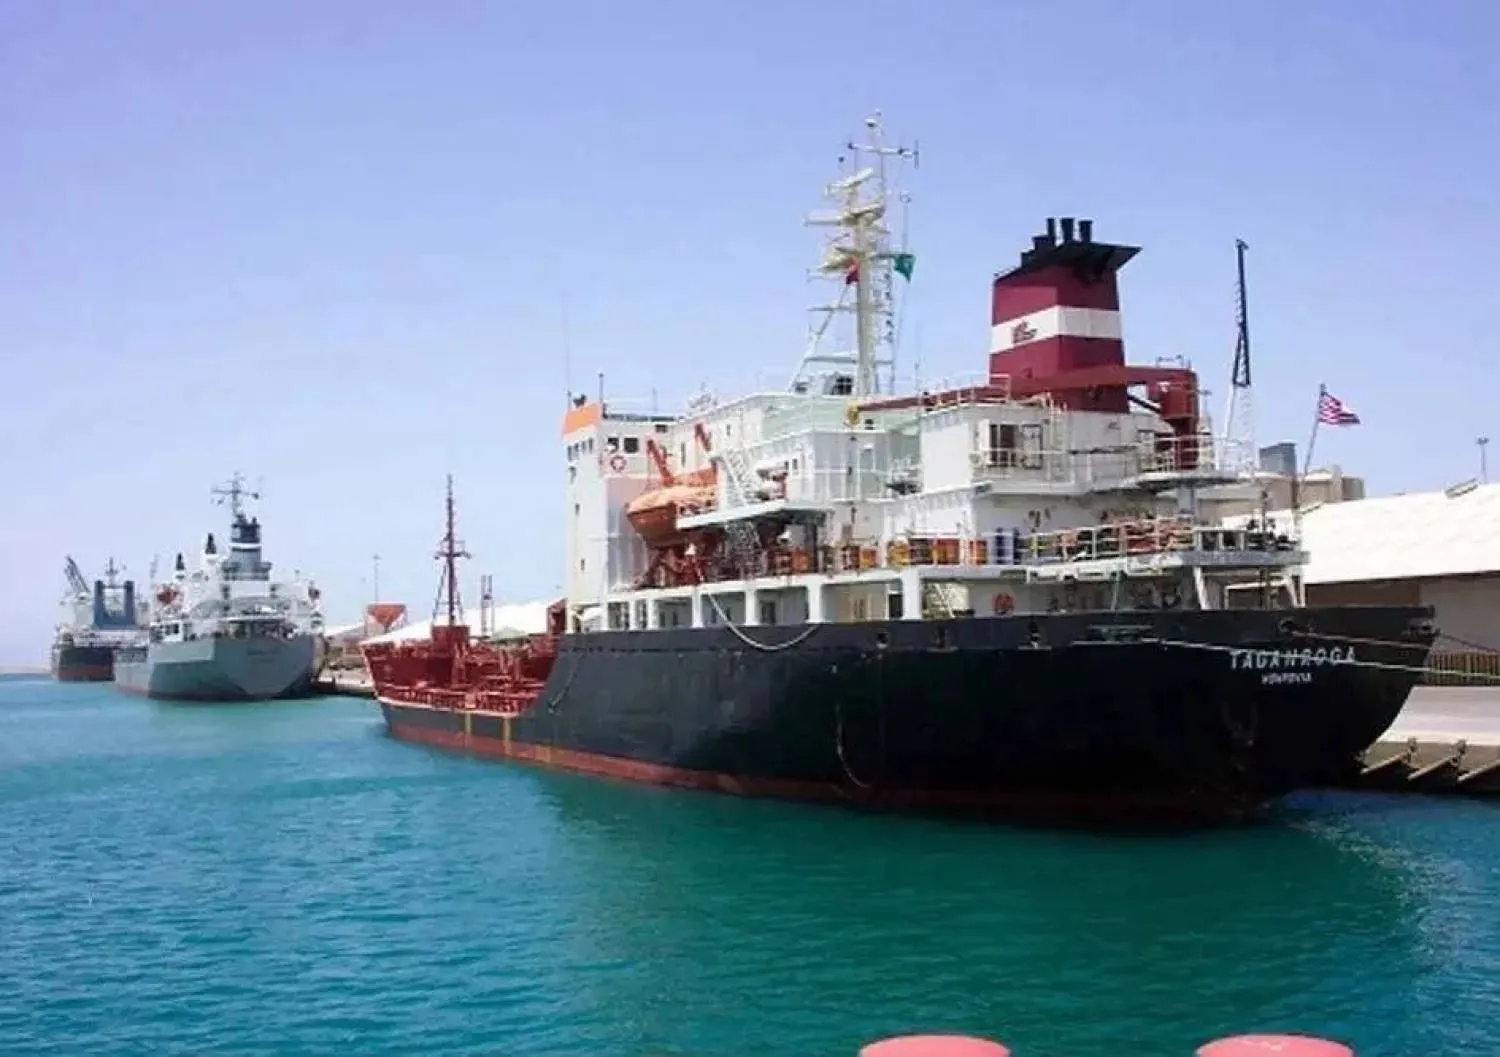

Saudi Oil Pipeline Boosts Exports 37.4%, Trade Surplus Hits Highest Since 2022

Naval vessels at Yanbu port on the Red Sea (SPA) 
TT

Saudi Oil Pipeline Boosts Exports 37.4%, Trade Surplus Hits Highest Since 2022

Naval vessels at Yanbu port on the Red Sea (SPA) 

Saudi Arabia’s merchandise trade surplus surged to its highest level since 2022 in March, driven by strong momentum in oil exports, which rose 37.4%, while the East-West pipeline played a central role in improving the flexibility of crude flows to Red Sea ports, according to official data and an industry expert.

Strategic energy infrastructure helped the Kingdom improve export efficiency and diversify access points to global markets, the General Authority for Statistics said in its international merchandise trade bulletin published on Thursday.

The authority reported that the merchandise trade surplus jumped 218.9% year-on-year in March, marking its highest level since 2022, supported by robust growth in oil exports.

Mohammad al-Sabban, a former senior adviser to the Saudi oil minister, told Asharq Al-Awsat that the rise in the Kingdom’s oil exports in March demonstrated the success of long-term planning through the construction and rehabilitation of the East-West pipeline, which transports crude and petroleum products to the Red Sea port of Yanbu.

He noted that the pipeline had helped Saudi Arabia bypass risks linked to the Strait of Hormuz after remaining closed for extended periods in the past.

Al-Sabban added that the government built the pipeline in the mid-1980s in what proved to be a sound strategic decision, explaining that its current capacity has reached 7 million barrels per day.

He said the infrastructure had contributed to the 37.4% rise in oil exports, equivalent to around SAR100 billion ($26.66 billion), increasing the share of oil in total merchandise exports.

“Many countries have seen their exports shrink after the recent crisis, but with the East-West pipeline in place, the Kingdom was able to raise total merchandise exports,” he stated.

According to the statistics authority, the total value of Saudi merchandise exports reached about SAR115 billion ($30.66 billion) in March, up 21.5% from the same month in 2025.

The increase was driven mainly by a sharp rise in oil exports, which climbed 37.4% to SAR92.5 billion, raising their share of total exports to 80.3% from 71.0% a year earlier.

Non-oil exports, including re-exports, fell 17.3%, while national non-oil exports excluding re-exports declined 27.0% to SAR14 billion ($3.73 billion).

Re-exported goods rose 2.5%, supported by a 51.1% jump in exports of “machinery, electrical equipment and parts thereof,” which accounted for 62.4% of total re-exported goods.

Imports fell 24.8% year-on-year in March to SAR58 billion ($15.46 billion), the report showed.

The sharp decline in imports, combined with higher exports, increased the ratio of non-oil exports to imports to 39.3%, compared with 35.8% a year earlier.

The report indicated that “machinery, electrical equipment and parts thereof” remained the most influential category in non-oil exports, accounting for 27.4% of the total after rising 46.2%. The same category also ranked first among imports at 30.4%, despite an 11.9% decline.

China remained Saudi Arabia’s top trading partner, accounting for 14.1% of Saudi exports, followed by India at 13.7% and Japan at 9.5%. Exports to the Kingdom’s top 10 destinations represented 69.8% of total exports.

China also remained the Kingdom’s largest source of imports, accounting for 26.7% of the total, followed by the United States at 8.4% and the United Arab Emirates at 7.1%.

Jeddah Islamic Port remained the main entry point for imports into the Kingdom, handling 29.8% of total imports.

For non-oil exports, King Abdulaziz International Airport in Jeddah ranked as the leading export gateway with a 23.4% share, followed by Jeddah Islamic Port at 21.2% and the Al-Batha land crossing at 8.2% of Saudi non-oil merchandise exports.


Copper Crawls Higher on Softer Dollar and Supply Issues

FILE PHOTO: A coil of copper rod sits on the production line for copper flat wire at the Wellascent factory in Ganzhou, Jiangxi province, China, August 14, 2025. REUTERS/Florence Lo/File Photo
TT

Copper Crawls Higher on Softer Dollar and Supply Issues

FILE PHOTO: A coil of copper rod sits on the production line for copper flat wire at the Wellascent factory in Ganzhou, Jiangxi province, China, August 14, 2025. REUTERS/Florence Lo/File Photo

Copper prices edged higher on Friday, supported by a weaker dollar and supply issues, but gains were modest due to worries about high oil prices hitting demand.

Benchmark three-month copper on the London Metal Exchange rose 0.5% to $14,319 a metric ton in official open-outcry trading. That marked a decline of 2% since the end of last week.

"Metals have seen light turnover again so far this session with copper finding some support with a slightly softer dollar, but the broader tone remains cautious," Neil Welsh, head of metals at broker Britannia Global Markets, said in a note.

"High energy costs stemming from the ⁠ongoing US-Iran conflict and ⁠signs of industrial weakness in China have weighed on sentiment across the complex."

The dollar index hit its strongest in 17 months this week, but weakened on Friday, making commodities priced in the US currency cheaper for buyers using other currencies.

LME copper has gained 16% over the past six months, largely due to a large shift in ⁠inventories to the US attracted by the prospect of tariffs there, creating shortages elsewhere.

Stocks in warehouses monitored by the Shanghai Futures Exchange <CU-STX-SGH> have slumped by 79% over the past four months to 38,744 tons, their lowest since January 2024.

The SHFE was closed for China's National Day and will reopen on October 8.

The prospect of less output in the world's largest copper producer Chile has also underpinned the market, with data on Wednesday showing production fell 12.8% year-on-year in August.

Supervisors at Chile's Escondida copper mine, the world's largest, rejected a collective ⁠contract offer, ⁠paving the way for a potential strike and adding to supply fears.

"This adds to an overall slump in output, as the industry struggles to maintain aging infrastructure amid difficult operating conditions," Reuters quoted Daniel Hynes, senior commodity strategist at ANZ, as saying in a note.

Among other metals, LME aluminium dipped 0.1% in official activity to $3,121.50 a ton and nickel also shed 0.1% to $15,620.

Zinc rose 0.2% to $3,732.50, lead ticked 0.3% higher to $1,863 and tin was little changed at $54,350.


Eurozone Inflation Hits Three-year High at 3.8% in September

FILE PHOTO: The logo of the European Central Bank (ECB) is pictured outside its headquarters in Frankfurt, Germany, April 26, 2018. REUTERS/Kai Pfaffenbach/File Photo
TT

Eurozone Inflation Hits Three-year High at 3.8% in September

FILE PHOTO: The logo of the European Central Bank (ECB) is pictured outside its headquarters in Frankfurt, Germany, April 26, 2018. REUTERS/Kai Pfaffenbach/File Photo

Eurozone inflation jumped to 3.8 percent in September, the highest level in three years, as the war in the Middle East fueled a surge in energy costs, official data showed Friday.

The figure for the 21-country euro area was up sharply from 3.2 percent in August and remains well above the European Central Bank's two-percent target, raising the likelihood of another interest rate increase.

The September reading published by the statistical office of the European Union was slightly higher than the 3.7 percent forecast by economists for Bloomberg.

As the US war against Iran drags on, the conflict has caused major disruptions to fuel supplies from the Middle East, including from the Strait of Hormuz, a key energy trade route.

Energy price increases surged to 18.8 percent in September, up from 14.3 percent a month earlier, AFP quoted Eurostat as saying.

Core inflation, which strips out volatile energy and food prices, rose to 2.5 percent last month from 2.4 percent in August.

Meanwhile, food and drinks inflation increased to 1.4 percent from 1.1 percent in August.

Eurozone inflation was last above 3.8 percent in September 2023, when it stood at 4.3 percent.


World Food Prices Near Four-year High in September

A street food vendor pushes a cart along the road in Ho Chi Minh City on October 2, 2026. (Photo by Nhac NGUYEN / AFP)
TT

World Food Prices Near Four-year High in September

A street food vendor pushes a cart along the road in Ho Chi Minh City on October 2, 2026. (Photo by Nhac NGUYEN / AFP)

World food prices rose in September to their highest in nearly four years as logistics disruptions and weather concerns affected crop markets, the United Nations' Food and Agriculture Organization said.

Fears about a severe El Nino weather pattern have pushed international sugar prices to an 18-month high, while a war-related collapse in Black Sea trade pushed wheat futures to a three-year peak early last month.

The FAO ⁠Food Price Index, ⁠which tracks monthly changes in international prices for a basket of food commodities, averaged 136.0 points, up from a revised 134.0 for August and the highest reading since November 2022.

FAO's benchmarks for cereal, sugar and vegetable oil ⁠prices all rose last month, though meat and dairy quotations fell.

“We are seeing a persistent and increasingly broad-based build up in global commodity prices, as disruptions in the Strait of Hormuz and the Black Sea combine with climate shocks, putting pressure on energy, transport and key food commodities,” FAO Chief Economist Maximo Torero said, according to Reuters.

“If sustained, these pressures will soon pass through to consumer food ⁠prices, especially ⁠in food and energy import-dependent countries,” he said in a statement.

In a separate report, FAO kept its forecast for global cereal production in 2026 almost unchanged at 2.979 billion metric tons, 2.1% below the previous year's peak but still the second-largest harvest on record.

FAO cut its forecast for world cereal trade in 2026/27 by 0.7% from September, citing lower wheat and maize export expectations due largely to constrained Black Sea shipping routes.